Global environmental change is increasingly impacting community health, with extreme weather events such as high heat posing growing threats. But these hazards do not affect all communities equally — some communities face far greater risks due to underlying vulnerabilities. To plan effective protections, both decision-makers and community members require comprehensive information to understand how extreme weather events are likely to impact public health. Community Health Resilience Tool (CHaRT) is an interactive mapping platform that was developed by CHanGE in 2023 to help users visualize and respond to extreme heat health risks. An updated version of the tool, CHaRT 2.0, was recently launched and is now able to provide heat risk information for all regions across the continental U.S. As extreme heat events become more frequent and severe, CHaRT prompts a timely question: could this tool serve as a virtual heat officer to guide local responses?
The role of heat officers
In 2021, Jane Gilbert became the first person in United States history to take on the role of chief heat officer for Miami-Dade County, FL. Miami-Dade County is one of the hottest regions in the U.S. with an average high temperature of 84° F. Under her role, she is responsible for addressing the health and economic burdens of extreme heat that impact residents. Her work often includes implementing heat reduction projects, working with various stakeholders to create a more heat-resilient city, and identifying vulnerable communities.
There are now two additional Chief Heat Officers in the U.S. working to protect the communities they represent: Dave Hondula of Phoenix and Marta Segura of Los Angeles. Both cities experience high average temperatures year-round and frequent heatwaves. In 2024, Phoenix experienced 113 consecutive days of temperatures above 100° F. Although this was a new record for the city, heat-related deaths in Maricopa County decreased from 645 to 608 from the previous year.
“Here in Phoenix, there was certainly a sense that more work needed to be done on heat. Things are getting warmer, heat is a significant public health hazard, and heat is a hazard that has fallen into a governance gap historically,” explains Hondula to The New York Times.
Extreme heat is now a chronic public health issue in many of the warmest U.S. cities. Chief Heat Officers are advocating for stronger government interventions to reduce heat-related illnesses and deaths in the cities they serve.
Understanding the CHaRT tool
At its core, CHaRT uses a fuzzy logic modeling approach to estimate risk within communities. The fuzzy logic system mimics how people naturally think and talk about risk, taking into account that people have subjective perspectives that impact their decisions. Unlike binary "yes or no” answers, fuzzy logic recognizes that people often describe situations on a spectrum of meaning, such as “kind of,” “extremely,” or “not really.” CHaRT uses fuzzy logic to bridge the gap between verbal descriptions and quantitative data by assigning values on a zero to one scale that represents a variable’s degree of truth. This modeling approach allows different types of data to be integrated and visualized in a manner that reflects the complexity of real-world communication, ultimately helping users make more nuanced decisions.
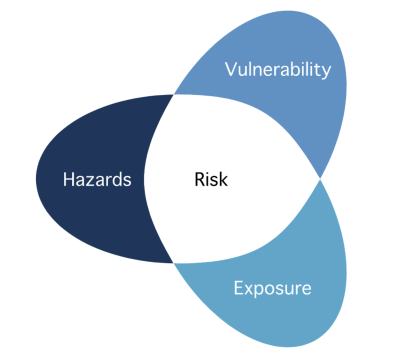
The conceptual framework that underpins CHaRT is adopted from the Intergovernmental Panel on Climate Change (IPCC) risk framework. This framework defines risk as the potential for adverse consequences. Risk is also defined as a combination of the following three components:
- Vulnerability: factors that amplify or dampen the effects of a hazard, including social, economic, biophysical, and environmental characteristics.
- Hazard: the damaging factor itself, in this case extreme heat.
- Exposure: the assets at risk from the hazard, in this case human lives, infrastructure, or natural resources.
Together, the fuzzy logic modeling approach and IPCC risk framework allow CHaRT to generate nuanced assessments of heat risk across different communities. CHaRT captures not just whether a place is at risk, but why – helping decision-makers prioritize the most impactful interventions.
Informing extreme heat decisions with CHaRT
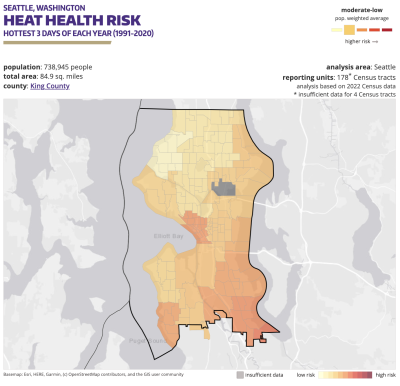
For cities that do not have designated Chief Heat Officers or that experience extreme heat events less frequently, CHaRT can act as their virtual heat officer. Decision-makers and government officials can use the tool to visualize which communities will experience the greatest risk due to vulnerabilities and exposure level. CHaRT can pinpoint communities that have the highest short- and long-term risk, highest tree planting priority, and highest record temperatures in recent years. This information can be transformed into action to provide the most at-risk communities with the resources and interventions they need to stay healthy during extreme heat events.
CHaRT 2.0 is an updated version of CHaRT that maps extreme heat risk for the entire continental U.S. Currently, CHanGE is conducting a trial to assess this new platform, therefore access to the tool is partially limited. However, guided tours are possible and those who are interested can reach out to heathealth@uw.edu. You can view the updated version of the CHaRT tool here.
- Heat